
How NDVI precision agriculture technology identifies nitrogen stress
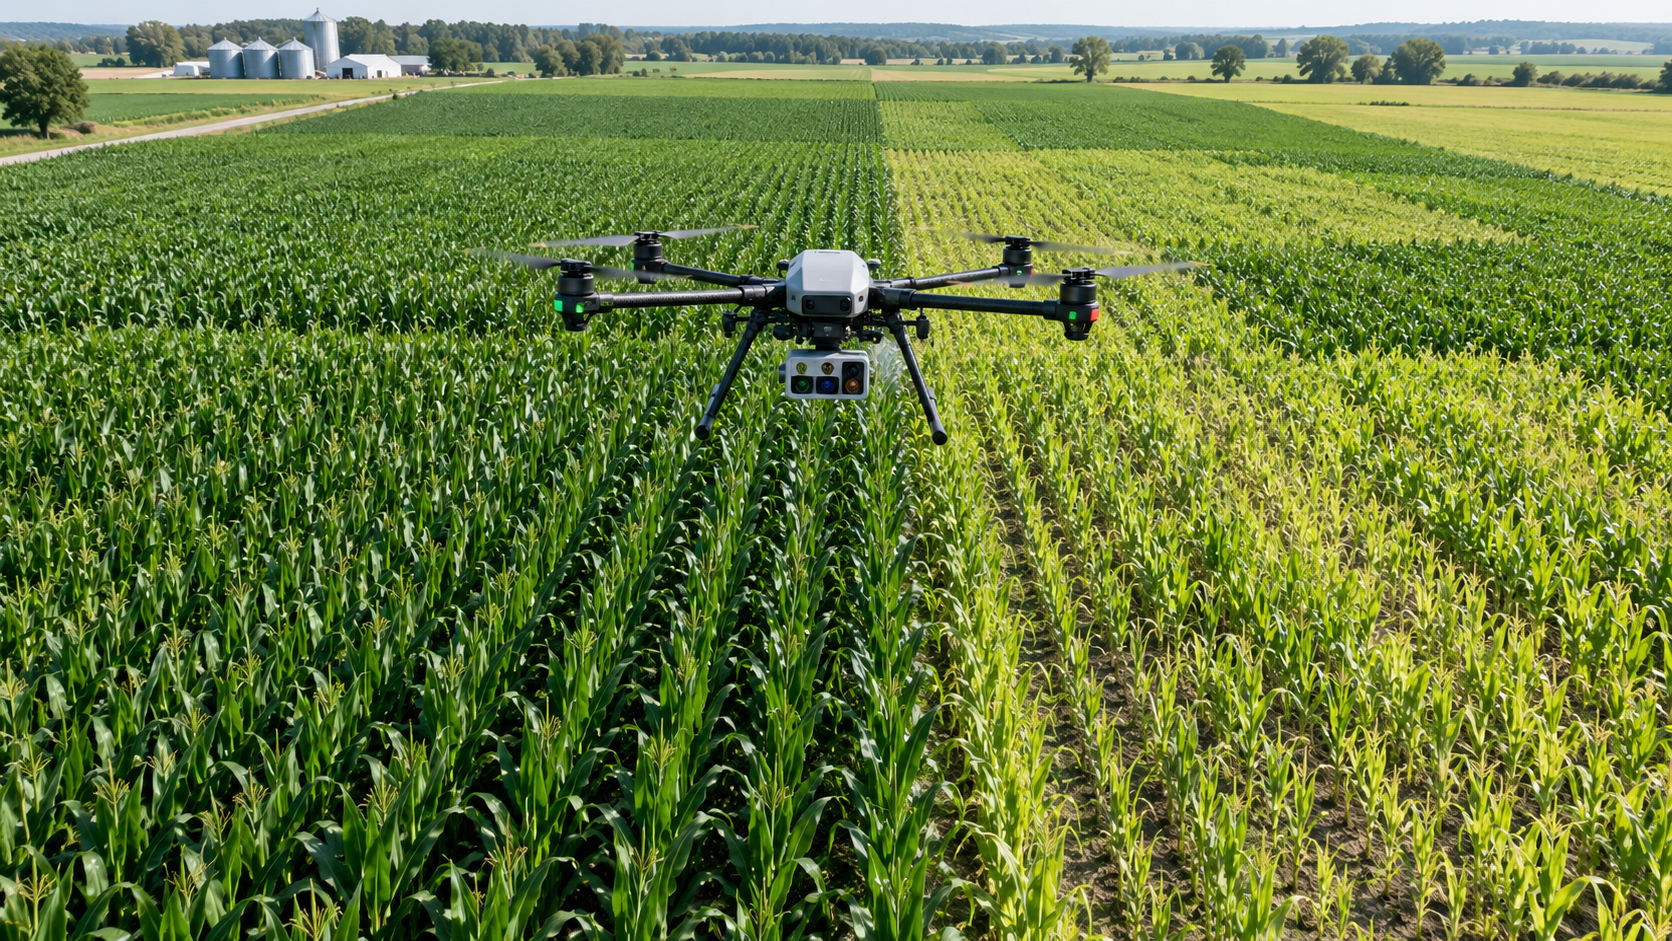
Introduction: Precision agriculture technology with NDVI helps technical evaluators detect early nitrogen stress before visible symptoms reduce crop performance. By analyzing multispectral reflectance data, NDVI maps reveal uneven crop vigor and identify zones that may require field scouting, tissue testing, or variable-rate nitrogen application.
For technical evaluation teams, the central conclusion is straightforward: NDVI can identify probable nitrogen stress efficiently, but it cannot independently diagnose nitrogen deficiency with complete certainty.
Its practical value comes from narrowing large fields into prioritized management zones, allowing agronomists and operators to verify causes before committing fertilizer, machinery capacity, and application budgets.
When integrated with ground truth data, application records, crop growth stages, and variable-rate equipment, NDVI becomes a useful decision layer rather than a standalone fertilizer recommendation.
What NDVI Actually Measures in a Crop Canopy
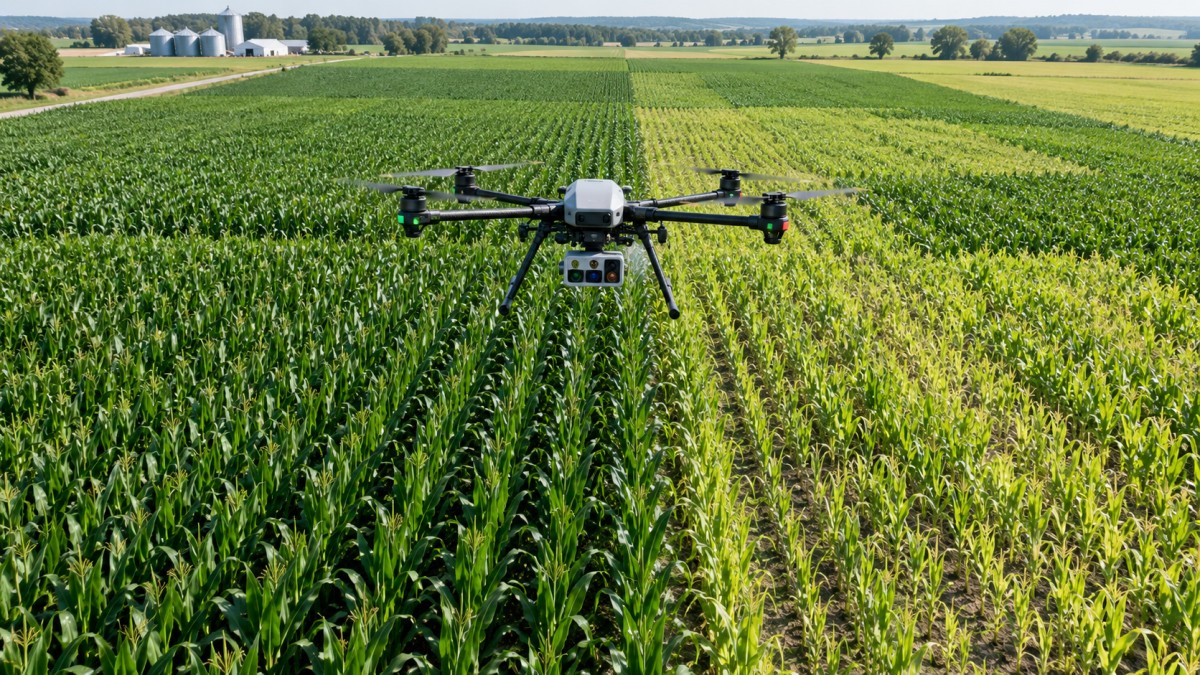
Normalized Difference Vegetation Index, or NDVI, estimates plant vigor by comparing how strongly vegetation reflects near-infrared light and absorbs visible red light.
Healthy leaves with active chlorophyll absorb more red light for photosynthesis and reflect substantial near-infrared energy because of their internal cellular structure.
Nitrogen supports chlorophyll formation, leaf expansion, and biomass growth. When nitrogen becomes limiting, crops often produce less chlorophyll and develop weaker canopy density.
Those physiological changes can lower NDVI values, particularly where neighboring plants have sufficient nutrients, water, and growing conditions for stronger canopy development.
The calculation is commonly expressed as near-infrared reflectance minus red reflectance, divided by near-infrared reflectance plus red reflectance. The result typically ranges from minus one to plus one.
Higher positive values usually indicate denser, more vigorous green vegetation. Lower values may indicate sparse plants, exposed soil, senescence, disease, compaction, water stress, or nutrient limitations.
This limitation matters during procurement and system design. An NDVI map identifies variation in crop response, not the specific agronomic reason behind that variation.
Technical evaluators should therefore assess NDVI technology as a screening and prioritization tool. Its effectiveness depends on the quality of follow-up observations and management decisions.
Why Nitrogen Stress Changes NDVI Patterns
Nitrogen-deficient plants generally show reduced chlorophyll concentration, slower leaf development, smaller leaf area, and less vigorous tillering or branching, depending on the crop.
In cereals, early nitrogen stress may appear as pale lower leaves, reduced canopy closure, and weaker biomass accumulation. These changes often emerge before obvious field-wide yellowing.
NDVI detects differences in canopy reflectance across a field, making it useful for identifying zones where crop development is falling behind comparable areas.
In maize, wheat, rice, canola, and many forage crops, nitrogen stress often creates lower-vigor patterns that correspond with soil variability, drainage differences, or uneven fertilizer availability.
However, the strength of the signal depends on crop stage. Very early imagery may contain too much soil background, while late-season NDVI can saturate in dense canopies.
NDVI saturation occurs when a crop canopy is already very dense. Additional biomass or nitrogen uptake may not produce a proportionally higher NDVI value.
For this reason, evaluators should ask suppliers about alternative indices, including NDRE, which uses red-edge wavelengths and can remain more responsive in high-biomass conditions.
NDVI remains highly valuable because it is widely supported by agricultural drones, satellites, handheld sensors, tractor-mounted cameras, and farm management software platforms.
How an NDVI Workflow Identifies Probable Nitrogen Stress
An effective workflow begins with a clear comparison baseline. Technical teams should define the crop, growth stage, field history, nitrogen program, expected yield level, and imagery timing.
The first operational step is collecting imagery under consistent conditions. Drone flights should use stable altitude, overlap, camera settings, and preferably comparable sunlight conditions.
Satellite imagery can cover many hectares economically, but cloud cover, spatial resolution, revisit frequency, and image timing may limit its usefulness for urgent in-season decisions.
After processing, the NDVI map should be reviewed for meaningful spatial patterns rather than isolated pixels. Continuous zones are more likely to represent actionable agronomic variation.
Low-NDVI areas are then compared with high-performing reference zones in the same field. This comparison is more useful than applying a universal NDVI threshold across different crops.
Field scouting follows map interpretation. Agronomists should inspect leaf color, plant population, root condition, growth stage, insect damage, disease symptoms, and soil moisture.
Soil tests, petiole tests, leaf tissue analysis, and nitrate sampling can confirm whether nitrogen availability is genuinely lower in the identified management zone.
Where practical, teams should compare as-applied fertilizer maps with NDVI layers. This may reveal skipped passes, clogged outlets, overlap problems, calibration errors, or prescription execution failures.
Only after verification should the operation create a variable-rate nitrogen prescription. The prescription must consider crop demand, potential yield response, product cost, weather risk, and regulatory limits.
Finally, post-application imagery and yield data should be retained. The goal is not merely correcting one field, but building a repeatable evidence base for future nitrogen decisions.
Separating Nitrogen Deficiency From Other Causes of Low NDVI
The greatest operational risk is treating every low-NDVI zone as nitrogen deficiency. Many factors reduce canopy vigor and can produce an apparently similar spectral pattern.
Water stress is a common example. Drought limits nutrient uptake, while waterlogging reduces root oxygen and can restrict nitrogen availability even when soil nitrogen is present.
Compacted headlands, wheel tracks, shallow soil, poor drainage, salinity, and uneven emergence can also create consistent low-vigor zones visible on NDVI maps.
Disease, insect feeding, herbicide injury, frost damage, and hail can reduce chlorophyll or leaf area. Applying more nitrogen in these areas may waste product.
Technical teams should overlay NDVI results with elevation maps, electrical conductivity data, soil zones, drainage plans, planting maps, and historical yield layers whenever available.
Repeated low-NDVI patterns across seasons may indicate structural field constraints rather than a one-time nitrogen shortage. These zones may require drainage, liming, compaction relief, or changed crop management.
Conversely, a new low-vigor pattern matching a fertilizer spreader pass, an irrigation zone, or a blocked planter row may point to an operational issue.
The evaluation standard should therefore be diagnostic confidence, not map attractiveness. A visually detailed image has limited value unless it supports a defensible management decision.
Choosing the Right Data Source for the Farm
Drone-based precision agriculture technology with NDVI offers high spatial resolution and flexible timing. It is especially useful for detailed diagnosis, trial plots, and irregular field boundaries.
Multispectral drones can identify variation at plant-row or sub-meter scales, depending on flight altitude and sensor configuration. Their value increases where response zones are small or complex.
Drone programs require trained pilots, flight permissions, image-processing capacity, calibration procedures, and a reliable process for converting maps into field actions.
Satellite NDVI is often more suitable for broad-acre monitoring because it reduces labor and can provide recurring coverage across dispersed farms or production regions.
Its limitations include cloud obstruction and resolution constraints. A ten-meter satellite pixel may combine crop rows, bare patches, headlands, and multiple soil conditions.
Tractor-mounted crop sensors provide immediate in-field measurements and can support real-time nitrogen application. They are valuable where equipment utilization and response speed justify capital investment.
Handheld sensors and crop scouting applications are lower-cost options for validation. They do not replace imagery, but they can strengthen interpretation and reduce false diagnoses.
System selection should be based on decision frequency, field size, crop value, labor availability, required resolution, data integration needs, and the farm's ability to execute prescriptions.
Turning NDVI Maps Into Variable-Rate Nitrogen Decisions
NDVI maps create value only when they influence management. For many operations, the most direct use is creating nitrogen management zones for targeted scouting and variable-rate application.
A common approach divides fields into high, medium, and low-vigor zones. These categories should be based on relative field performance, not arbitrary color breaks.
Low-vigor zones do not automatically receive more nitrogen. If poor vigor is caused by poor stand establishment or restricted rooting, extra nitrogen may not generate economic yield response.
Moderate-vigor zones can often offer the best response opportunity. These areas may have enough crop potential to convert additional nitrogen into meaningful biomass or grain yield.
High-vigor zones may already have adequate nitrogen, or they may have the strongest yield potential. The appropriate rate depends on crop demand and local response curves.
Technical evaluators should confirm that prescription files are compatible with spreaders, sprayers, injection systems, and controllers used across the farm equipment fleet.
Application accuracy also matters. Section control, rate-control response time, boom configuration, product flow consistency, GPS quality, and boundary handling affect realized results.
For liquid products, assess pump performance and nozzle distribution. For granular fertilizer, evaluate spinner calibration, spreading width, wind sensitivity, and material characteristics.
Without accurate execution, even a well-designed NDVI prescription can produce uneven nutrient delivery. Equipment capability must be evaluated alongside sensing and analytics capability.
How to Evaluate ROI and Technical Performance
Return on investment should not be measured only by fertilizer savings. The broader value includes reduced scouting time, earlier issue detection, improved application targeting, and better documentation.
A practical evaluation compares treated and untreated zones, variable-rate and flat-rate fields, or replicated nitrogen strips with similar soil and crop conditions.
Record nitrogen rate, fertilizer cost, application cost, yield, grain quality, protein where relevant, imagery date, rainfall, irrigation events, and observed crop condition.
Yield monitor data should be cleaned before analysis. Incorrect flow readings, delay settings, moisture data, header width, and GPS drift can distort apparent treatment results.
Economic analysis should estimate marginal revenue from yield or quality improvement, then subtract sensing, software, labor, validation, prescription, and application costs.
In some seasons, the main return is avoiding unnecessary nitrogen on weak-response areas. In others, it is protecting yield potential in zones with early nutrient stress.
Technical buyers should request evidence from crops and conditions similar to their operations. Generic demonstration maps are less useful than documented workflows with verified outcomes.
Key supplier questions include sensor calibration methods, radiometric correction, map accuracy, export formats, agronomy support, data ownership, integration options, and seasonal service capacity.
Implementation Requirements That Determine Success
Successful deployment requires more than purchasing a multispectral camera or subscribing to a mapping platform. Farms need a defined process for collecting, interpreting, validating, and acting on data.
Assign clear ownership for each stage: imagery capture, processing, agronomic review, ground verification, prescription approval, equipment loading, application, and post-season analysis.
Data timing is critical. A map delivered after the crop has passed its responsive growth stage may be technically accurate but commercially irrelevant.
Standard operating procedures should document flight timing, cloud thresholds, calibration targets, naming conventions, field boundaries, version control, and prescription approval requirements.
Teams should also train operators to recognize data limitations. An NDVI map is an input to agronomic judgment, not permission to bypass scouting or crop testing.
For large-scale operations, integration with digital farm management systems is essential. Field records, machinery telemetry, fertilizer inventory, and yield data should remain connected.
That integrated record improves traceability for internal management, food production groups, sustainability reporting, lender reviews, and future equipment investment decisions.
Conclusion: NDVI Is Most Valuable as a Verified Decision System
Precision agriculture technology with NDVI can identify probable nitrogen stress early by revealing spatial differences in crop vigor before symptoms become widespread and yield losses become harder to recover.
Its strongest use is directing technical teams toward the areas that deserve immediate attention. NDVI reduces the uncertainty and labor involved in finding underperforming crop zones.
Yet NDVI does not measure nitrogen directly. Water, compaction, disease, poor establishment, and other stresses can create similar signals, making field validation essential.
For technical evaluators, the best investment is a connected workflow: dependable sensing, repeatable imagery, agronomic verification, compatible application equipment, and measurable post-season performance analysis.
When those components are in place, NDVI-based nitrogen management can reduce input waste, improve response targeting, and provide stronger evidence for machinery and digital agriculture investments.
Related Intelligence