
Variable-Rate Fertilization Maps: What Data Actually Improves ROI
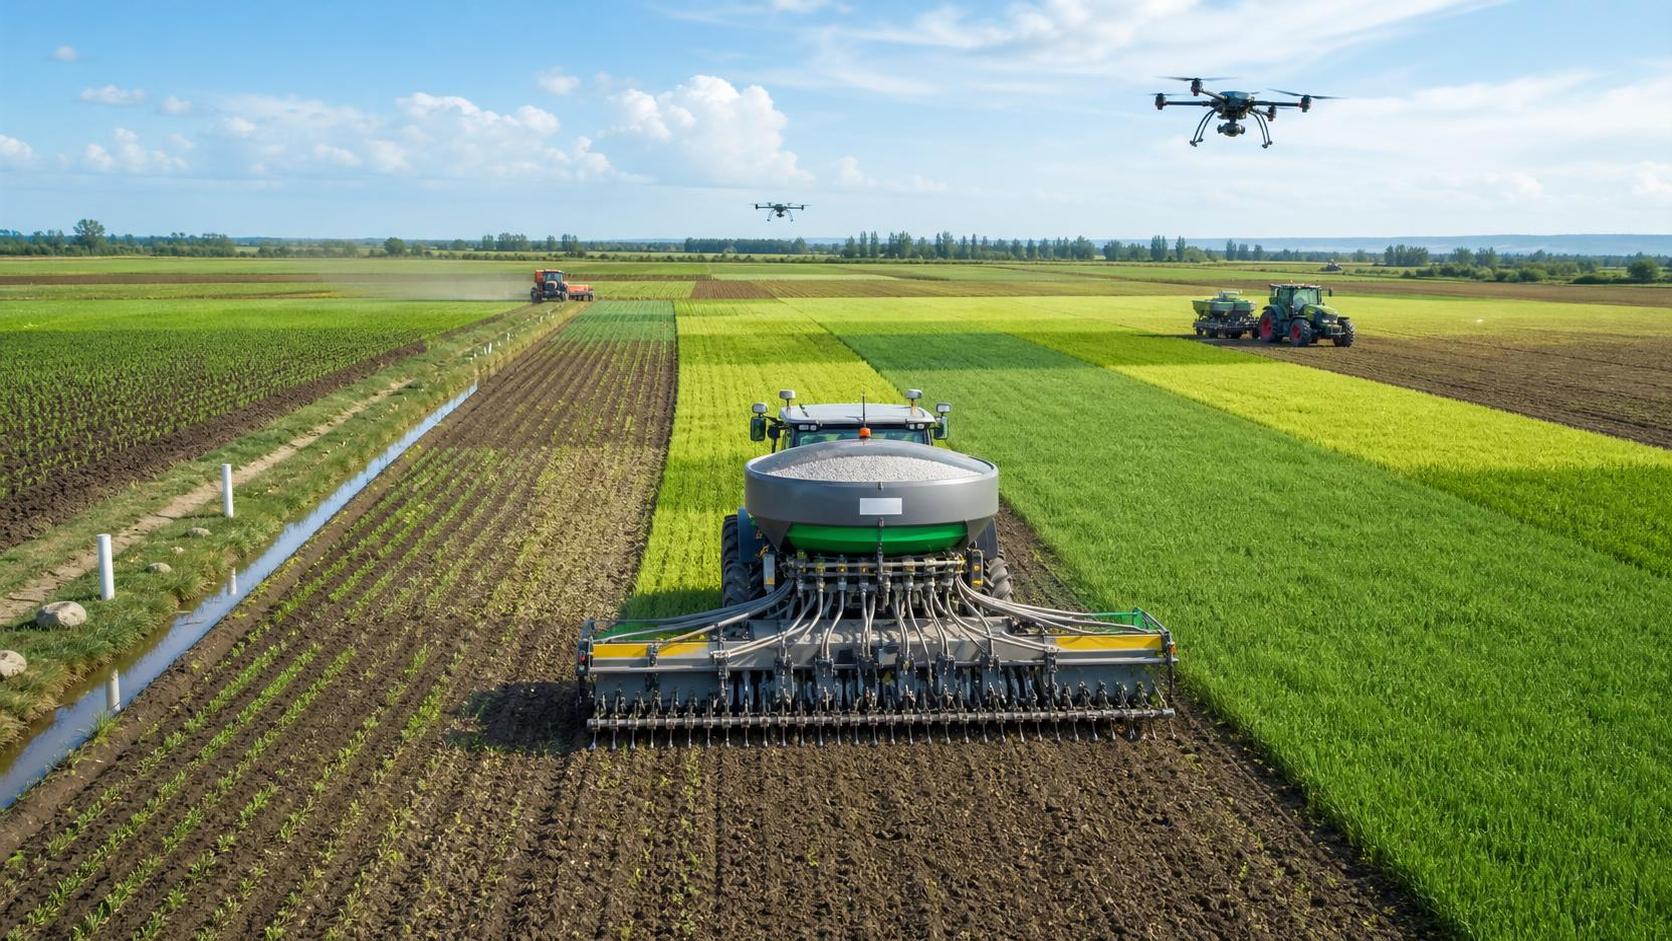
Variable-Rate Fertilization Maps: which data layers really change the economics?
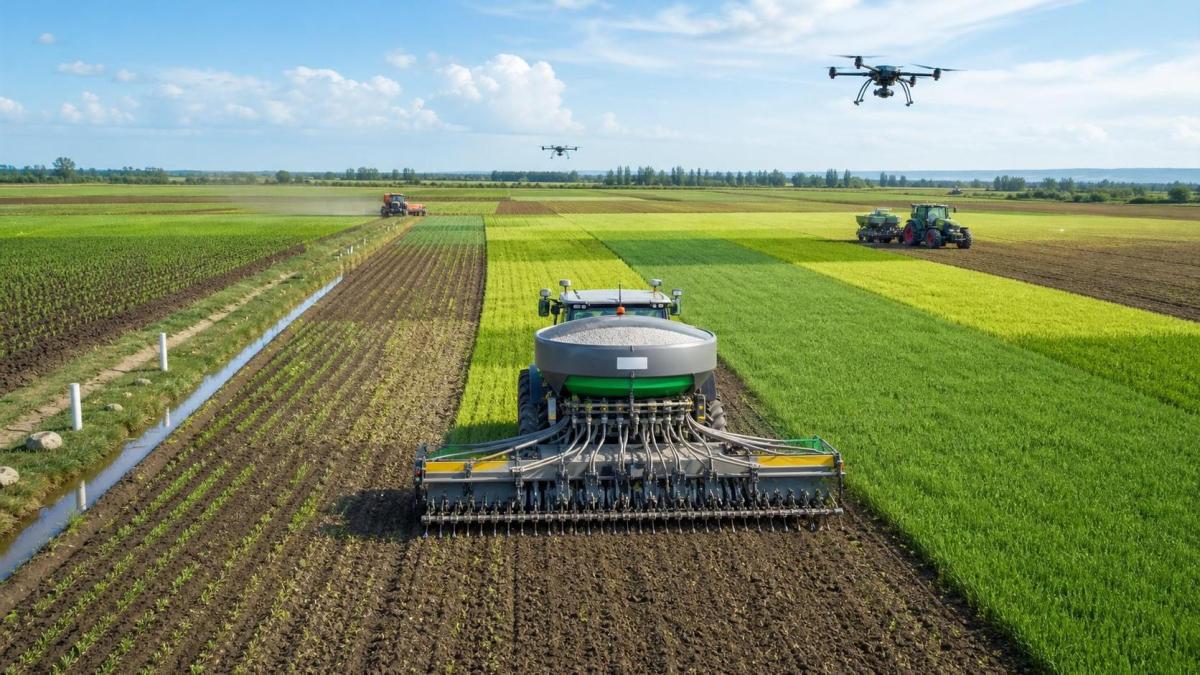
Variable-rate fertilization maps sound precise on paper, yet return on investment often depends on a small number of reliable data layers.
That matters because fertilizer budgets, machine time, and field logistics all sit inside the same cost equation.
In practice, the best prescription map is not the one with the most data.
It is the one that improves placement decisions without adding noise, delay, or unnecessary software complexity.
Across smart agriculture platforms such as SAMS, this topic connects crop sensing, machinery capability, digital farm management, and per-acre margin control.
The central question is simple: which datasets behind variable-rate fertilization maps actually improve ROI, and which ones mostly look impressive in a demo?
Do variable-rate fertilization maps deliver ROI by themselves?
Usually, no.
Variable-rate fertilization maps are decision tools, not value generators on their own.
The return comes from better nutrient allocation, fewer overapplied zones, and more stable crop performance in weaker areas.
If spreaders, sprayers, or applicators cannot execute rates accurately, the map has limited financial value.
The same problem appears when RTK guidance is weak, calibration is inconsistent, or application timing misses the crop window.
A useful way to judge ROI is to separate three layers.
- Data quality: does the map reflect real field variability?
- Execution quality: can the machine follow the prescription accurately?
- Economic relevance: are nutrient savings or yield gains large enough to cover cost?
When all three align, variable-rate fertilization maps can improve gross margin and reduce wasted input.
When one breaks, ROI becomes uncertain very quickly.
Which datasets usually improve ROI first?
The strongest starting point is rarely exotic data.
Most profitable variable-rate fertilization maps begin with a few proven layers that explain yield potential and nutrient response clearly.
In broad-acre operations, the highest-value layers are often these:
- Multi-year yield maps, because they show stable performance zones over time.
- Soil sampling by management zone or grid, because nutrient levels still need physical validation.
- Topography and drainage patterns, because water movement strongly affects nutrient availability and crop uptake.
- As-applied records, because they confirm whether the prescription was actually executed correctly.
Remote sensing data, including NDVI or multispectral imagery, can add value, especially for in-season nitrogen decisions.
Still, imagery is most useful when it validates known patterns, not when it replaces agronomic context.
More advanced layers, such as satellite biomass trends, drone imagery, conductivity scans, and weather-normalized models, can help.
But they usually produce better returns after the basic stack is already clean.
A practical comparison table
The table below reflects a common ROI ranking for variable-rate fertilization maps in operational farming systems.
Why do some maps look sophisticated but fail in the field?
Because more data does not automatically mean better prescriptions.
A common failure point is using one-season imagery to define long-term nutrient strategy.
A low-biomass zone might reflect compaction, pest pressure, drainage issues, or planting errors rather than fertility demand.
If that zone receives more fertilizer without diagnosis, the map may increase cost without improving yield.
Another weak point is data misalignment between platforms, monitors, and machine controllers.
Prescription layers may be agronomically sound, yet file conversion, georeferencing errors, or delayed syncing can damage execution.
This is where equipment and software compatibility matter as much as agronomy.
SAMS often treats precision farming as a connected system, not a single input map.
That is the right lens.
Variable-rate fertilization maps only perform when sensors, agronomic interpretation, machine control, and reporting all stay consistent.
How should variable-rate fertilization maps be compared before purchase?
The useful comparison is not map provider versus map provider alone.
The better question is whether each option supports a stronger decision cycle from data capture to application proof.
A disciplined review usually includes these checkpoints.
- Does the method rely on historical yield stability or on a single seasonal image?
- Are soil test intervals and sampling density clear?
- Can the platform export files directly to existing spreaders, drones, or terminals?
- Is there a closed loop between prescription, application log, and post-harvest analysis?
- Can the system separate fertility response from drainage, disease, or stand establishment issues?
- What is the cost per acre once mapping, sampling, support, and integration are included?
These questions prevent a common buying mistake.
That mistake is paying for advanced analytics before confirming that the field operation can execute them consistently.
For mixed fleets, this matters even more.
A cheaper map can create higher lifetime cost if compatibility workarounds slow the season or increase operator error.
What does a realistic implementation timeline and cost profile look like?
A realistic rollout of variable-rate fertilization maps usually takes more than one season to judge properly.
Base fertility corrections may show value gradually, while in-season nitrogen strategies can show results sooner.
The timeline often looks like this:
- Season 1: clean historical data, sample soils, verify machine control, create first management zones.
- Season 2: refine prescriptions, compare treated zones, validate application logs against harvested outcome.
- Season 3: standardize successful rules, remove low-value layers, and scale across more acres.
Cost should also be viewed beyond subscription fees.
The real budget includes soil sampling, drone flights if used, integration labor, terminal updates, calibration time, and training.
For many operations, the fastest payback comes from using variable-rate fertilization maps on the most variable fields first.
Uniform fields often show smaller economic gains, even when the maps look technically polished.
Where does the risk usually sit?
The biggest risk is not underbuying data.
It is overestimating what unverified data can explain.
If a prescription map is treated as a complete diagnosis tool, fertilizer spending can shift without solving the underlying field constraint.
So which data stack deserves priority right now?
For most operations, the highest-priority stack behind variable-rate fertilization maps is still straightforward.
Start with calibrated multi-year yield data, credible soil sampling, topographic context, and dependable as-applied records.
Then add imagery where it improves timing or clarifies in-season crop response.
Drone and multispectral layers become far more valuable when they support a known agronomic question.
They are much less valuable when used as standalone proof of fertilizer need.
The most durable ROI usually comes from operational discipline rather than data abundance.
That means tighter calibration, clean records, compatible equipment, and repeatable field-by-field evaluation.
Anyone reviewing variable-rate fertilization maps should build a short decision sheet before expanding investment.
- List the fields with the highest visible variability.
- Confirm which data layers are already reliable.
- Check machine compatibility from prescription import to applied-rate reporting.
- Define what success means per acre, per nutrient, and per season.
That approach turns variable-rate fertilization maps from a precision feature into a measurable business decision.
Related Intelligence